
As 2022 winds to a close, there is no need to sugarcoat it: This was one of the toughest years ever for U.S. investors.
Not only did stocks tumble, but bonds recorded one of their worst performances in history. Whether you prefer stocks or bonds, there was nowhere to hide this year — except in cash, which did better as interest rates rose.
Just how bad was 2022 for stocks? We’ve rounded up the worst years in terms of performance of the Standard & Poor’s 500 Index over the past century. Find out where this year ranks compared to the worst of the past.
1931
Performance of the S&P 500: -43.84%
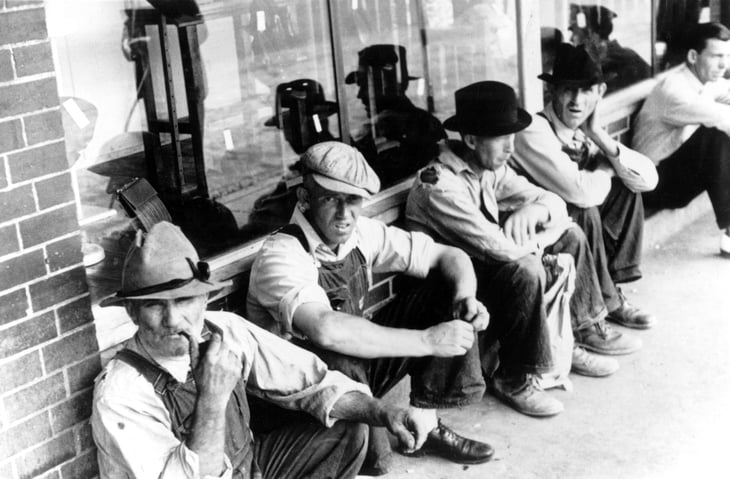
Investors spent most of the Great Depression licking their wounds and waiting to bounce back from their stock market losses.
It took a long time — and a world war — before stocks were truly on the mend.
During the sad, painful decade of the 1930s, the single worst year was 1931. That year also marked the biggest one-year decline in the S&P over the past 94 years.
In 1932, the market would decline once again, capping the only run of four consecutive losing years in the stock market from 1928 to today.
2008
Performance of the S&P 500: -36.55%
In early 2007, the first signs of trouble began to appear in the housing market. The woes were mostly limited to “subprime” borrowers, or folks with below-average credit scores who had gotten mortgages.
In May of that year, Ben Bernanke, the then-Federal Reserve chairman, made the following remarks at a financial conference in Chicago:
“We believe the effect of the troubles in the subprime sector on the broader housing market will be limited and we do not expect significant spillovers from the subprime market to the rest of the economy or to the financial system.”
A little more than a year later, all heck broke loose.
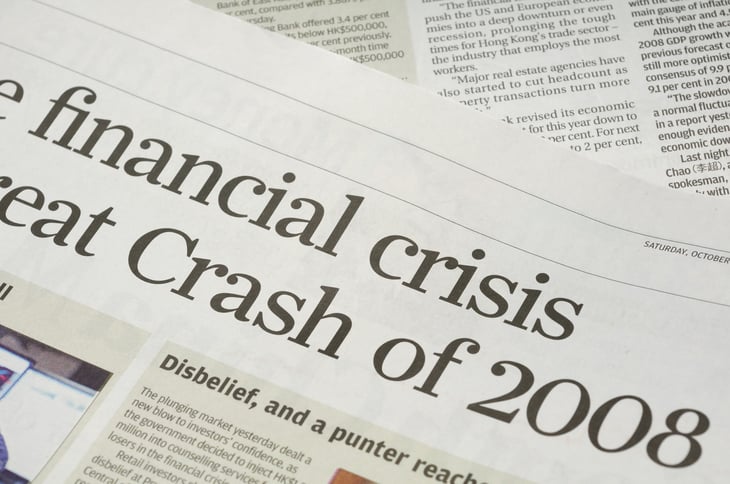
As the economy sputtered and the financial system began to melt down, stocks went into an epic slide.
When all was said and done, 2008 was the second-worst year for stocks since the Great Depression began.
1937
Performance of the S&P 500: -35.34%
The 1930s were a tough time, with America stuck in the quicksand of the Great Depression. Just as the nation would begin to pull its way out of the quagmire, it would quickly begin to sink again.
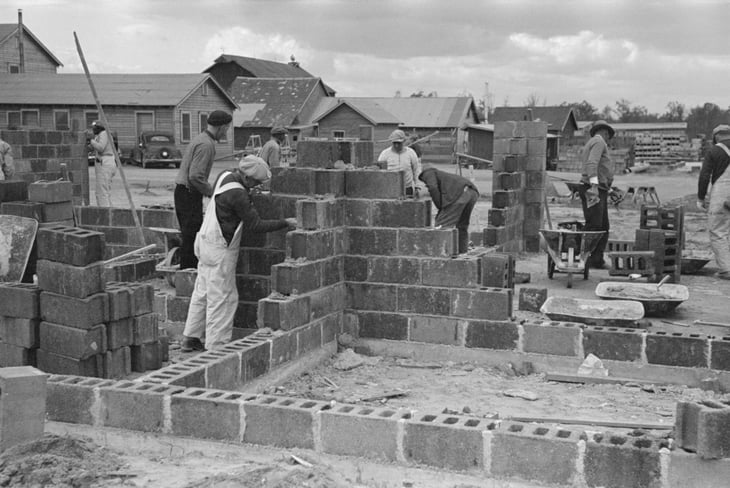
Under President Franklin D. Roosevelt, the government created New Deal projects — such as the one seen above — to try to get people back to work. And at times, it looked like those efforts would turn things around.
However, in 1937, after a period of apparent recovery, the U.S. economy took another major dive, and stock prices plunged along with it.
1974
Performance of the S&P 500: -25.90%
In the words of financial writer Jason Zweig, the 1973-74 bear market was a “slow-motion mudslide” that “seemed endless.”
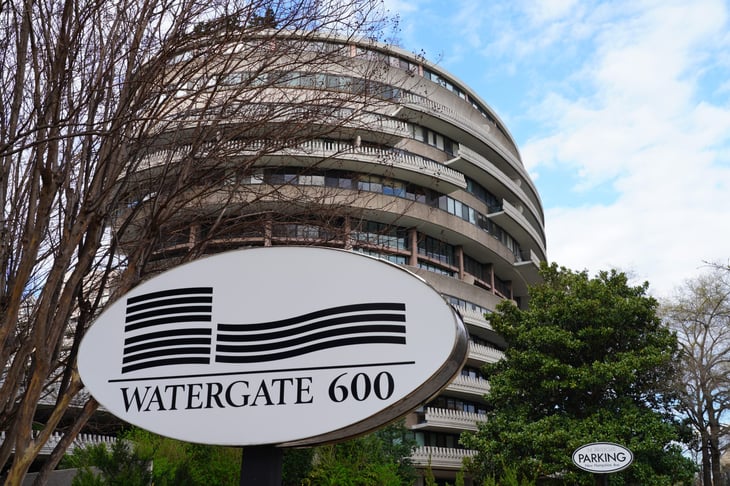
A series of factors — an oil crisis, the Watergate scandal and runaway inflation — all came together to cause what was at the time the worst bear market since the Depression.
Recalling that period in 1997, William M.B. Berger, chairman emeritus of the Berger Funds, told Zweig:
“It was so painful that I don’t even want my memory to bring it back.”
Although neither Zweig, Berger nor anyone else knew it in 1997, another nasty bear market — even worse than the 1973-74 debacle — was just a few years away.
1930
Performance of the S&P 500: -25.12%
This was the first full year of the Great Depression. When the stock market crashed in October 1929, ending a golden period of prosperity known as the Roaring Twenties, it kicked off a period of the worst economic times in U.S. history.
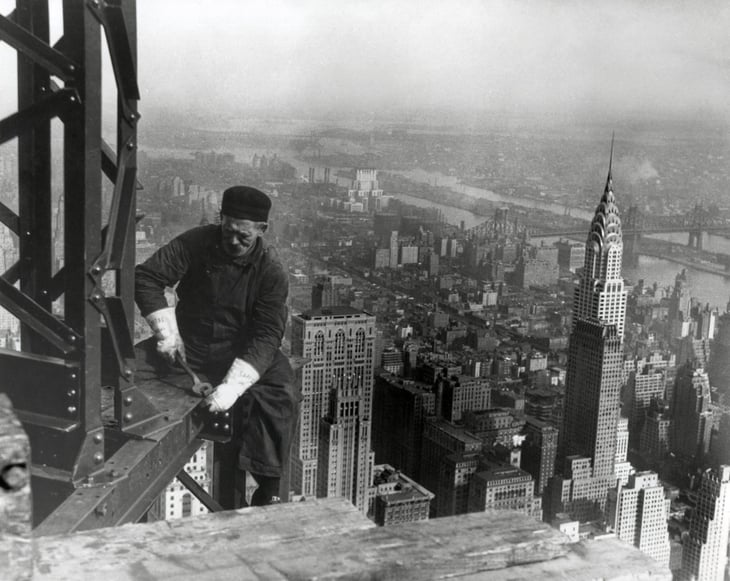
Life went on — as the above image of a man helping to construct the Empire State Building attests — but it had fundamentally changed.
By November 1929, stocks had lost half their value. They would decline further in 1930. And that was just the start of what would turn out to be the worst-ever bear market.
2002

Performance of the S&P 500: -21.97%
Ask investors about the most terrible periods in stock market history, and you are likely to hear about the bear market mauling of the 1930s, the back-to-back declines of 1973-74 and the freefall of 2008.
However, it seems as if today’s market watchers largely have forgotten the period of 2000-2002, when stocks fell for three consecutive years.
That hadn’t happened since a trio of declines between 1939-1941.
1973
Performance of the S&P 500: -14.31%
As 1973 dawned, hopes were high. The previous year, the S&P 500 finished up 18.76%, the third straight year of gains for the market.
In January 1973, Time magazine predicted that for many stocks, “1973 is shaping up as a gilt-edged year.” As the publication dutifully reported:
“Most Wall Street analysts are convinced that the market will continue to climb smartly in 1973. Brokers looking for a marked increase in trading volume see signs that small investors are beginning to overcome fears instilled by the Wall Street slide of 1970 and return to the market.”
Instead, 1973 marked the beginning of an epic bear market that would remain unrivaled for the next quarter-century.
1941
Performance of the S&P 500: -12.77%
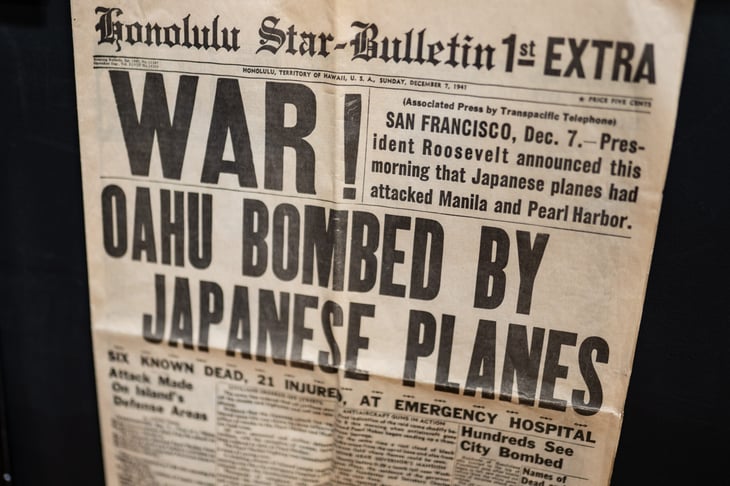
When people think of 1941, they almost instantly gravitate to the bombing of Pearl Harbor on Dec. 7 of that year. And indeed, much of the decline in the 1941 stock market occurred after the attack on the U.S. Navy base in Hawaii.
Pearl Harbor was an awful event that pushed the U.S. into World War II. However, it came with a silver lining: It was the war effort itself that boosted the U.S. economy and finally ended the Great Depression.
2001
Performance of the S&P 500: -11.85%
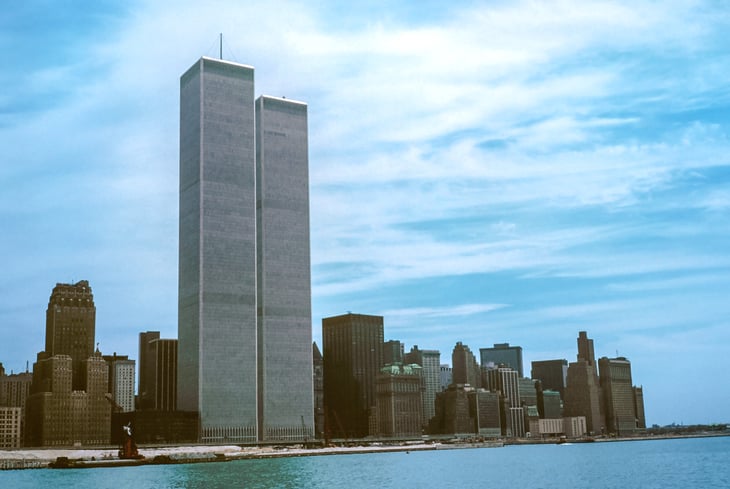
The sharp market decline in 2001 — the year of the terror attack on the World Trade Center towers in New York City — was the second in a three-year period that saw investors give back a big portion of the record runup in stock prices they had enjoyed during the 1990s.
As 2001 came to a close, optimists were hopeful that after two years of declines — stocks also had fallen in 2000, by 9.03% — better days were just ahead.
Instead, the worst was yet to come in 2002.
1940
Performance of the S&P 500: -10.67%
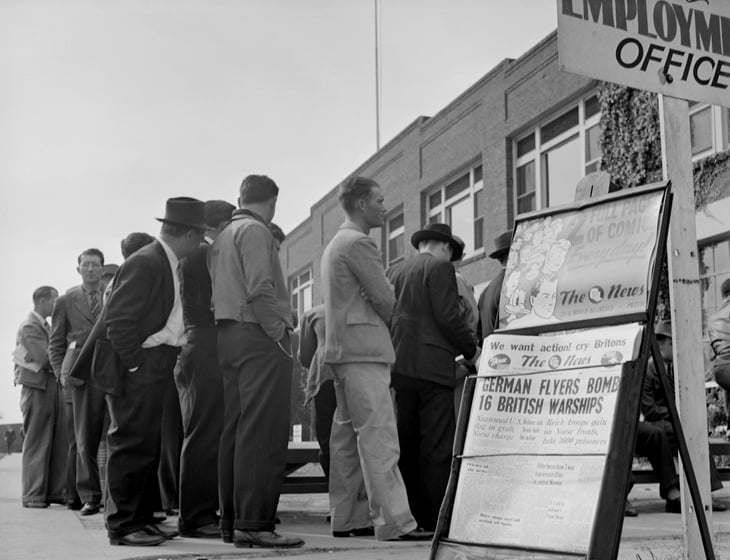
Things were looking up in the early part of 1940, with stocks rallying strongly.
But storm clouds were brewing in Europe. By April, Germany had forced its way into both Norway and Denmark, and the crisis that became World War II deepened considerably.
The U.S. stock market soon began to fall, and it continued to do so the next year.
2022 (not final)
Performance of the S&P 500: -19.17%
Finally, we arrive at this year. We’ve placed 2022 at the end of this list, since the year is not yet over. However, as of the end of the trading on Dec. 16, the S&P 500 is down 19.17% year to date.
That means that if this was the last day of the month, 2022 would earn its ignominious place as the seventh-worst year for stock market returns in modern times, after 2002 and ahead of 1973.
What will 2023 bring? Absolutely nobody knows.
So, buckle up and enjoy the ride.
