Editor’s Note: This story originally appeared on Smartest Dollar.
The COVID-19 pandemic and resulting economic crisis caused unprecedented financial strain throughout the U.S., prompting the government to offer economic relief packages at every level, from stimulus checks for personal use to local fiscal recovery funds at the state level.
But the Paycheck Protection Program (PPP) is one of the most memorable.
To help businesses stay afloat, the government-led initiative allowed companies with fewer than 500 employees to apply for forgivable loans. PPP loans were intended to help businesses keep their doors open with less stress, retain employees, and boost suffering local economies. PPP borrowers could be eligible for loan forgiveness if the funds were used for specific business expenses during a period of time after disbursement.
Funds that were distributed through the PPP varied by state as a result of differences in COVID-19 impacts, politics, small-business density, and other local economic factors.
To determine the locations that received the most PPP funds, researchers at Smartest Dollar calculated the total PPP funds per capita. In the event of a tie, the location that received the greater total PPP funds was ranked higher.
The data used in this analysis is from the U.S. Small Business Administration’s Office of Capital Access. Find details on our methodology at the end. Here are the U.S. cities that took the most PPP money.
15. Tulsa, OK

- Total PPP funds per capita: $4,034
- Total PPP funds: $1,661,810,498
- Median PPP loan amount: $20,832
- Share of approved PPP funds forgiven: 97.1%
- Industry sector with the most PPP funds: Professional, Scientific, and Technical Services
14. Dallas, TX

- Total PPP funds per capita: $4,252
- Total PPP funds: $5,477,944,135
- Median PPP loan amount: $20,832
- Share of approved PPP funds forgiven: 94.8%
- Industry sector with the most PPP funds: Professional, Scientific, and Technical Services
13. New Orleans, LA

- Total PPP funds per capita: $4,486
- Total PPP funds: $1,691,082,004
- Median PPP loan amount: $20,207
- Share of approved PPP funds forgiven: 93.3%
- Industry sector with the most PPP funds: Accommodation and Food Services
12. Houston, TX

- Total PPP funds per capita: $4,737
- Total PPP funds: $10,834,232,116
- Median PPP loan amount: $20,800
- Share of approved PPP funds forgiven: 93.5%
- Industry sector with the most PPP funds: Professional, Scientific, and Technical Services
11. Washington, D.C.

- Total PPP funds per capita: $4,867
- Total PPP funds: $3,261,369,374
- Median PPP loan amount: $20,833
- Share of approved PPP funds forgiven: 93.3%
- Industry sector with the most PPP funds: Professional, Scientific, and Technical Services
10. Denver, CO

- Total PPP funds per capita: $4,928
- Total PPP funds: $3,506,291,330
- Median PPP loan amount: $20,833
- Share of approved PPP funds forgiven: 94.8%
- Industry sector with the most PPP funds: Accommodation and Food Services
9. Seattle, WA

- Total PPP funds per capita: $4,995
- Total PPP funds: $3,665,686,086
- Median PPP loan amount: $21,162
- Share of approved PPP funds forgiven: 95.1%
- Industry sector with the most PPP funds: Professional, Scientific, and Technical Services
8. Portland, OR

- Total PPP funds per capita: $5,071
- Total PPP funds: $3,256,506,651
- Median PPP loan amount: $20,832
- Share of approved PPP funds forgiven: 96.3%
- Industry sector with the most PPP funds: Professional, Scientific, and Technical Services
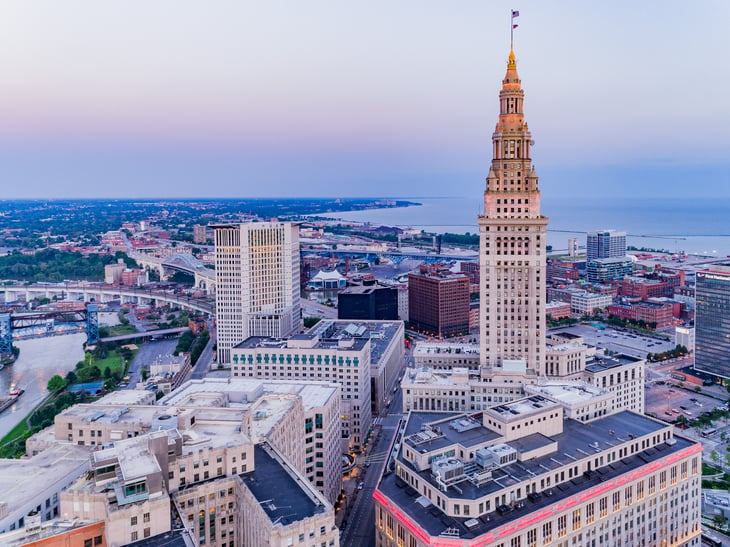
7. Cleveland, OH

- Total PPP funds per capita: $5,831
- Total PPP funds: $2,146,000,840
- Median PPP loan amount: $20,800
- Share of approved PPP funds forgiven: 92.1%
- Industry sector with the most PPP funds: Professional, Scientific, and Technical Services
6. San Francisco, CA

- Total PPP funds per capita: $5,870
- Total PPP funds: $4,785,179,081
- Median PPP loan amount: $20,833
- Share of approved PPP funds forgiven: 92.1%
- Industry sector with the most PPP funds: Professional, Scientific, and Technical Services
5. Las Vegas, NV

- Total PPP funds per capita: $6,333
- Total PPP funds: $4,095,729,826
- Median PPP loan amount: $20,207
- Share of approved PPP funds forgiven: 90.1%
- Industry sector with the most PPP funds: Accommodation and Food Services
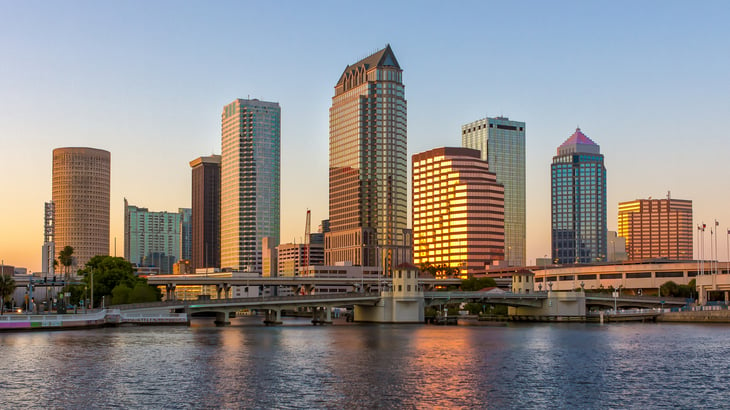
4. Tampa, FL

- Total PPP funds per capita: $7,498
- Total PPP funds: $2,902,065,816
- Median PPP loan amount: $18,400
- Share of approved PPP funds forgiven: 93.6%
- Industry sector with the most PPP funds: Professional, Scientific, and Technical Services
3. Minneapolis, MN

- Total PPP funds per capita: $8,388
- Total PPP funds: $3,567,798,865
- Median PPP loan amount: $20,833
- Share of approved PPP funds forgiven: 96.9%
- Industry sector with the most PPP funds: Professional, Scientific, and Technical Services
2. Atlanta, GA

- Total PPP funds per capita: $10,393
- Total PPP funds: $5,160,027,929
- Median PPP loan amount: $20,587
- Share of approved PPP funds forgiven: 90.3%
- Industry sector with the most PPP funds: Professional, Scientific, and Technical Services
1. Miami, FL

- Total PPP funds per capita: $12,245
- Total PPP funds: $5,386,742,701
- Median PPP loan amount: $17,707
- Share of approved PPP funds forgiven: 87.6%
- Industry sector with the most PPP funds: Professional, Scientific, and Technical Services
Methodology

The data used in this analysis is from the U.S. Small Business Administration’s Office of Capital Access’ Paycheck Protection Program FOIA dataset.
To determine the locations that received the most Paycheck Protection Program (PPP) funds, researchers at Smartest Dollar calculated the total PPP funds per capita.
In the event of a tie, the location that received the greater total PPP funds was ranked higher. All PPP loan records were assigned to locations based on the individual establishment’s business address. To improve relevance, only cities with at least 100,000 residents were included.
