Editor’s Note: This story originally appeared on Self.
Rising prices have been top of mind for most U.S. households since early 2021.
One of the biggest drivers of price increases has been skyrocketing energy costs.
A surge in natural gas prices can explain much of the increase. Global demand for natural gas remains high, while the supply — much of which comes from Russia — has been cut.
According to the U.S. Census Bureau, the typical American household spends $245 per month on utilities, or 3.5% of their household income. At over 60%, electricity accounts for the largest share of monthly utility costs.
While the typical American household spends around $245 per month on utilities, utility spending varies significantly due to factors such as climate, energy prices, and household size.
To determine the metropolitan areas with the highest utility bills, researchers on behalf of Self Financial analyzed the latest data from the U.S. Census Bureau. The researchers ranked metros according to median utilities spending as a share of household income.
Researchers also calculated median monthly spending on sewer and water, gas, electricity and other fuels. See details on the methodology section at the end.
Here are the U.S. metropolitan areas with the highest utility bills.
15. Hartford-East Hartford-Middletown, CT

- Utilities spending as a share of household income: 3.4%
- Median monthly utilities spending: $294
- Median monthly electric spending: $150
- Median monthly gas spending: $100
- Median monthly sewer and water spending: $42
- Median monthly spending on other fuels: $100
14. Virginia Beach-Norfolk-Newport News, VA-NC

- Utilities spending as a share of household income: 3.5%
- Median monthly utilities spending: $273
- Median monthly electric spending: $150
- Median monthly gas spending: $70
- Median monthly sewer and water spending: $63
- Median monthly spending on other fuels: $42
13. Cleveland-Elyria, OH

- Utilities spending as a share of household income: 3.6%
- Median monthly utilities spending: $233
- Median monthly electric spending: $100
- Median monthly gas spending: $80
- Median monthly sewer and water spending: $50
- Median monthly spending on other fuels: $46
12. Indianapolis-Carmel-Anderson, IN

- Utilities spending as a share of household income: 3.6%
- Median monthly utilities spending: $250
- Median monthly electric spending: $140
- Median monthly gas spending: $40
- Median monthly sewer and water spending: $42
- Median monthly spending on other fuels: $40
11. Kansas City, MO-KS

- Utilities spending as a share of household income: 3.6%
- Median monthly utilities spending: $272
- Median monthly electric spending: $150
- Median monthly gas spending: $60
- Median monthly sewer and water spending: $50
- Median monthly spending on other fuels: $29
10. Providence-Warwick, RI-MA

- Utilities spending as a share of household income: 3.7%
- Median monthly utilities spending: $293
- Median monthly electric spending: $140
- Median monthly gas spending: $100
- Median monthly sewer and water spending: $50
- Median monthly spending on other fuels: $100
9. New Orleans-Metairie, LA

- Utilities spending as a share of household income: 3.8%
- Median monthly utilities spending: $235
- Median monthly electric spending: $150
- Median monthly gas spending: $50
- Median monthly sewer and water spending: $46
- Median monthly spending on other fuels: $17
8. Oklahoma City, OK

- Utilities spending as a share of household income: 3.8%
- Median monthly utilities spending: $236
- Median monthly electric spending: $130
- Median monthly gas spending: $60
- Median monthly sewer and water spending: $48
- Median monthly spending on other fuels: $25
7. Detroit-Warren-Dearborn, MI

- Utilities spending as a share of household income: 3.8%
- Median monthly utilities spending: $265
- Median monthly electric spending: $140
- Median monthly gas spending: $80
- Median monthly sewer and water spending: $55
- Median monthly spending on other fuels: $42
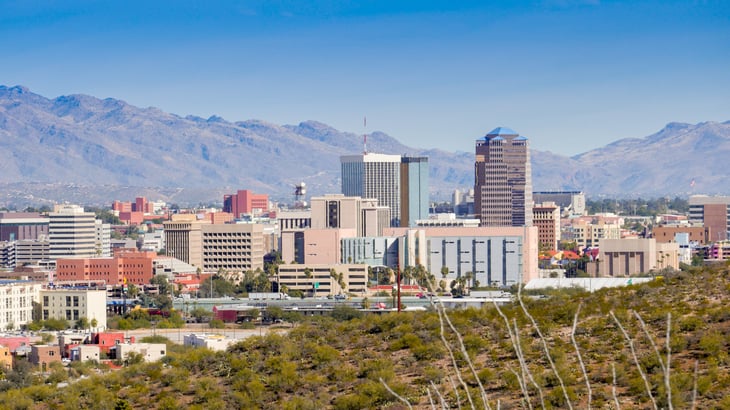
6. Tucson, AZ

- Utilities spending as a share of household income: 3.9%
- Median monthly utilities spending: $235
- Median monthly electric spending: $140
- Median monthly gas spending: $40
- Median monthly sewer and water spending: $51
- Median monthly spending on other fuels: $21
5. Pittsburgh, PA

- Utilities spending as a share of household income: 3.9%
- Median monthly utilities spending: $263
- Median monthly electric spending: $110
- Median monthly gas spending: $90
- Median monthly sewer and water spending: $60
- Median monthly spending on other fuels: $67
4. Fresno, CA

- Utilities spending as a share of household income: 4.0%
- Median monthly utilities spending: $280
- Median monthly electric spending: $180
- Median monthly gas spending: $50
- Median monthly sewer and water spending: $77
- Median monthly spending on other fuels: $33
3. Louisville/Jefferson County, KY-IN

- Utilities spending as a share of household income: 4.1%
- Median monthly utilities spending: $267
- Median monthly electric spending: $160
- Median monthly gas spending: $80
- Median monthly sewer and water spending: $60
- Median monthly spending on other fuels: $21
2. Memphis, TN-MS-AR

- Utilities spending as a share of household income: 4.2%
- Median monthly utilities spending: $261
- Median monthly electric spending: $200
- Median monthly gas spending: $60
- Median monthly sewer and water spending: $21
- Median monthly spending on other fuels: $17
1. Birmingham-Hoover, AL

- Utilities spending as a share of household income: 4.5%
- Median monthly utilities spending: $284
- Median monthly electric spending: $180
- Median monthly gas spending: $60
- Median monthly sewer and water spending: $40
- Median monthly spending on other fuels: $25
Methodology

To determine the U.S. metropolitan areas with the highest utility bills, researchers on behalf of Self Financial analyzed the latest data from the U.S. Census Bureau’s 2021 American Community Survey Public Use Microdata Sample.
The researchers ranked metros according to median utilities spending as a share of household income. In the event of a tie, the metro with higher median monthly utilities spending was ranked higher.
Researchers also calculated median monthly electric spending, median monthly gas spending, median monthly sewer and water spending, and median monthly spending on other fuels.
To improve relevance, only metropolitan areas with at least 100,000 people were included in the analysis.
